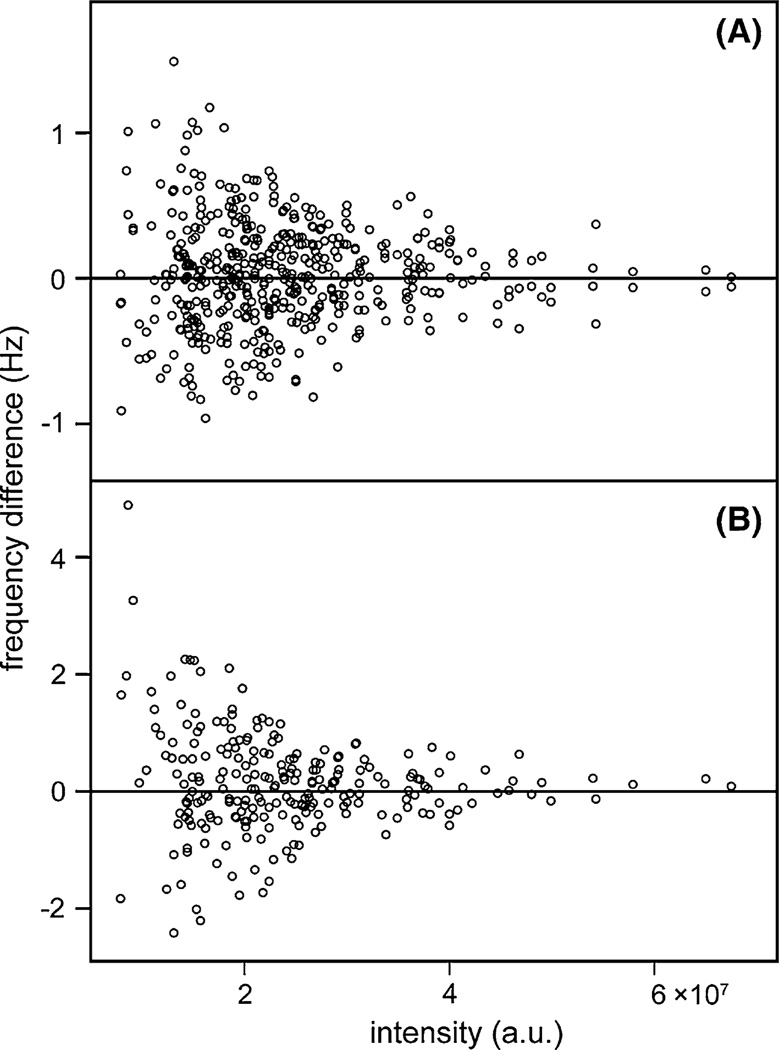
Fig. 5.
Reproducibility of cross peak positions between NUS and fully sampled spectra. A Differences between 15N frequencies measured in the SMILE-reconstructed spectrum of Fig. 3B and the reference spectrum (Fig. 3A), recorded with full sampling. The difference is plotted against the intensity of the resonance in the SMILE-reconstructed spectrum. B Differences between 1H frequencies in the fully sampled and SMILE-reconstructed spectrum. The average line widths in the SMILE-reconstructed spectrum are ca 11 Hz (15N), and 19 Hz (1H). See Fig. S2 for analogous comparison obtained with SCRUB

