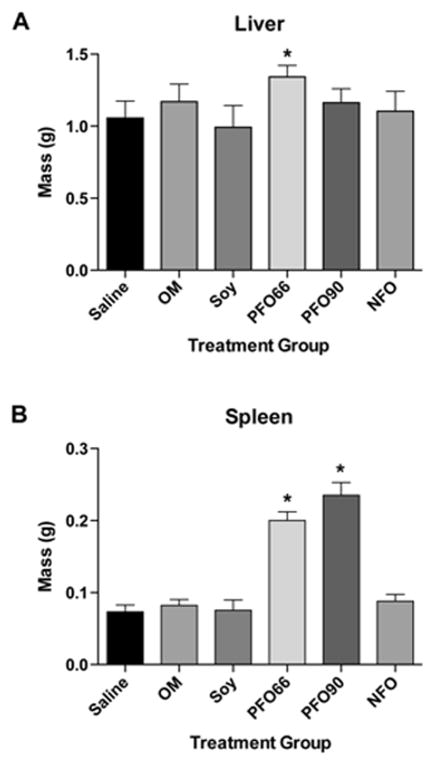
Figure 2. PFO66 and PFO90 result in organomegaly, while NFO preserves normal organ size.
Liver (A) and spleen (B) masses after 19 days of 2.4mg/kg/day intravenous lipid emulsion administration. (*) indicated p<0.05 compared to the saline treated group. In A, PFO66 liver mass was significantly different than all groups except the OM group by single-factor ANOVA with Tukey multiple comparison test. Saline, SO, OM, PFO90, and NFO liver masses were not significantly different. In B, PFO66 and PFO90 groups were significantly different than saline, OM, SO, and NFO groups by single-factor ANOVA with Tukey multiple comparison test. Saline, OM, SO, and NFO groups were not significantly different from each other.

