
Figure 3.
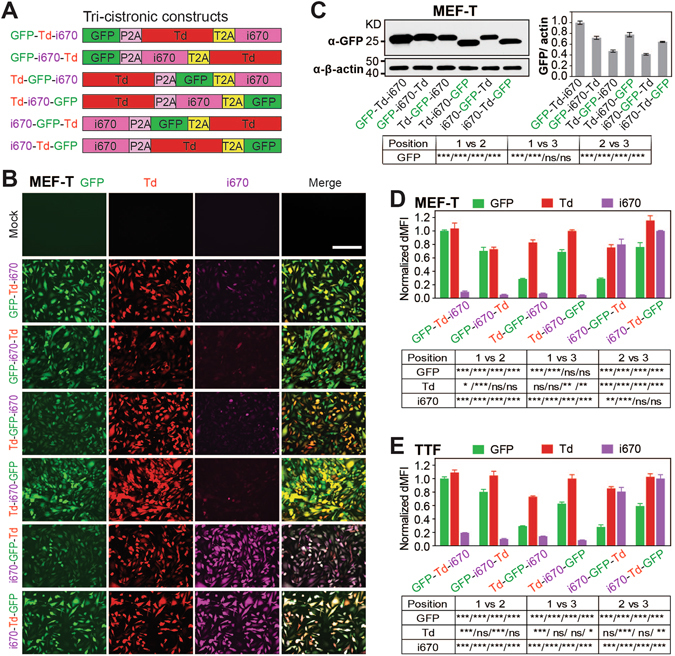
Tri-cistronic 2A constructs: positional effects on gene expression. (A) Tri-cistronic constructs in a P2A-T2A backbone expressing three FPs GFP, Td and i670 in different orders. (B and C) MEF-T cells were transduced with retroviruses (pMXs) encoding the different 2A constructs for 3 days. Live fluorescent images of these cells were taken at 20X (B) and then cells were collected for (C) western blotting analysis for GFP expression, or (D) flow cytometry analysis for dMFI of GFP (green bar), Td (red bar), and i670 (purple bar). (C) GFP was quantified and normalized to the β-actin loading control. (D) dMFI was normalized to that of GFP-Td-i670 for GFP, Td-i670-GFP for Td, and i670-Td-GFP for i670. (E) The same as (D) except performed in TTF. Mean ± SEM of multiple experiments were shown. Results from one-way ANOVA and bonferroni correction were summarized in a table. Scale bar = 200 µm.