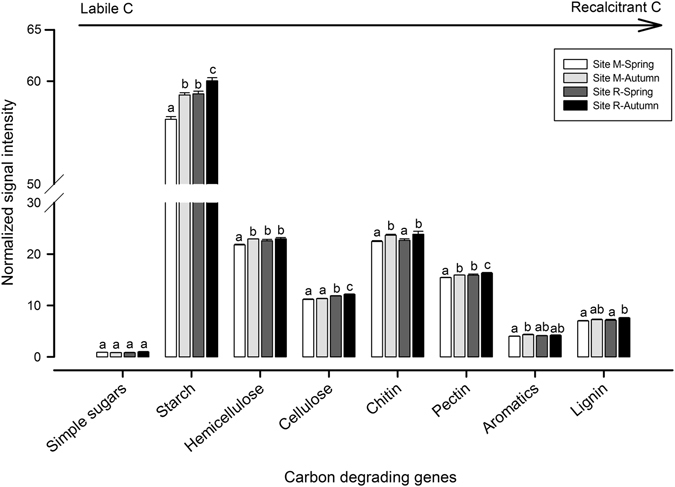
Figure 5.

Normalized signal intensities for key C degrading genes detected using Geochip 5.0 and found at the deciduous forest site M (545–570 m asl) and the coniferous forest site R (1,724–1,737 m) in spring and autumn. The genes were grouped according to the different substrates. The targeted substrates were arranged in order from labile to recalcitrant C. For each substrate, values followed by different letters are significantly different (p ≤ 0.05) according to Tukey’s HSD test. Bars represent standard deviation.
