
Figure 7.
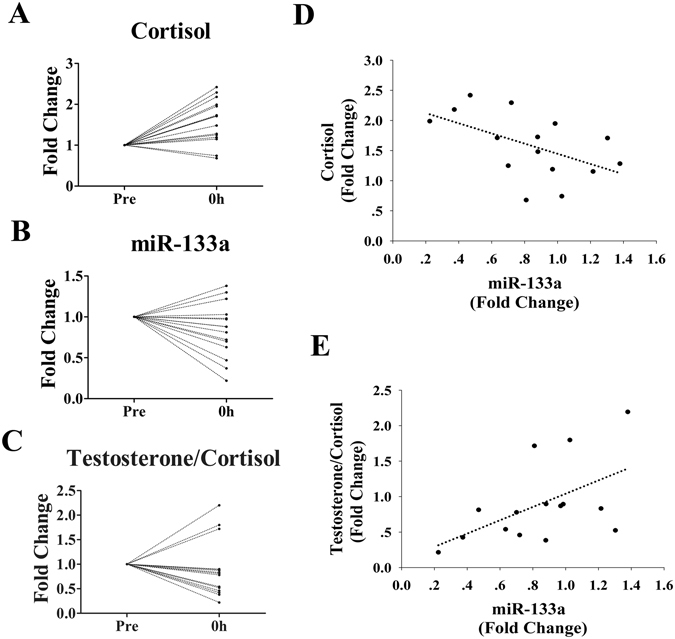
Correlations of miR-133a with plasma cortisol and testosterone/cortisol levels (n = 15). For each subject, the plasma levels of miR-133a, cortisol and testosterone at baseline (Pre) were assigned a fold change of 1, and measurements obtained immediately after exercise (0 h), after 1 h of recovery (1 h) and after 24 h of recovery (24 h) were compared to the baseline. Scatterplots show the plasma levels of cortisol (A), miR-133a (B) and testosterone/cortisol (C). A direct correlation is observed between plasma levels of miR-133a and cortisol (D) and testosterone/cortisol (E).