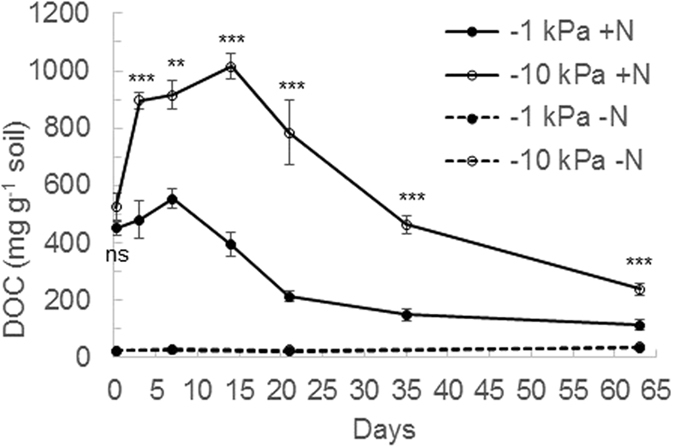
Figure 3.

Changes in soil cold water extractable organic carbon (DOC) over time. Concentrations of soil DOC under near saturated (−1 kPa) or field capacity (−10 kPa) soil moisture conditions, following urea application (+N) or nil urea application (−N). Symbols are means (n = 4) with vertical error bars the standard error of the mean. Asterisks *,**,***indicate significant differences between moisture treatments under urea treatments at P < 0.05, P < 0.01, and P < 0.001, respectively.
