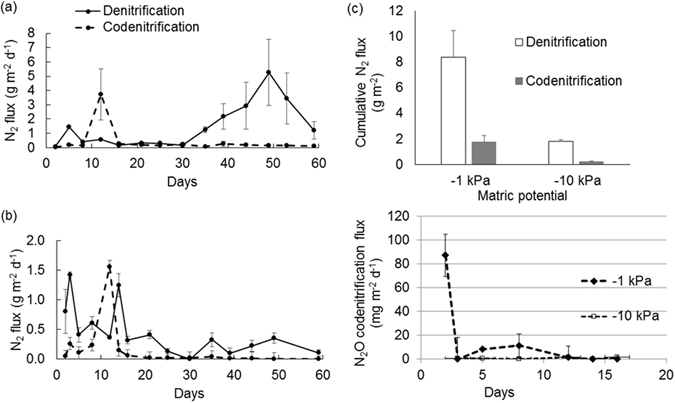
Figure 8.

Denitrification and codenitrification fluxes over time. The codenitrification and denitrification fluxes, over time since 15N urea addition, are shown as daily N2 fluxes for (a) soil at −1 kPa (b) soil at −10 kPa and (c) as cumulative codenitrification and denitrification N2 fluxes, while (d) is the N2O codenitrification flux, over time since 15N urea addition, as daily N2O fluxes. Symbols are means (n = 4) with vertical error bars the standard error of the mean.
