Fig. 1.
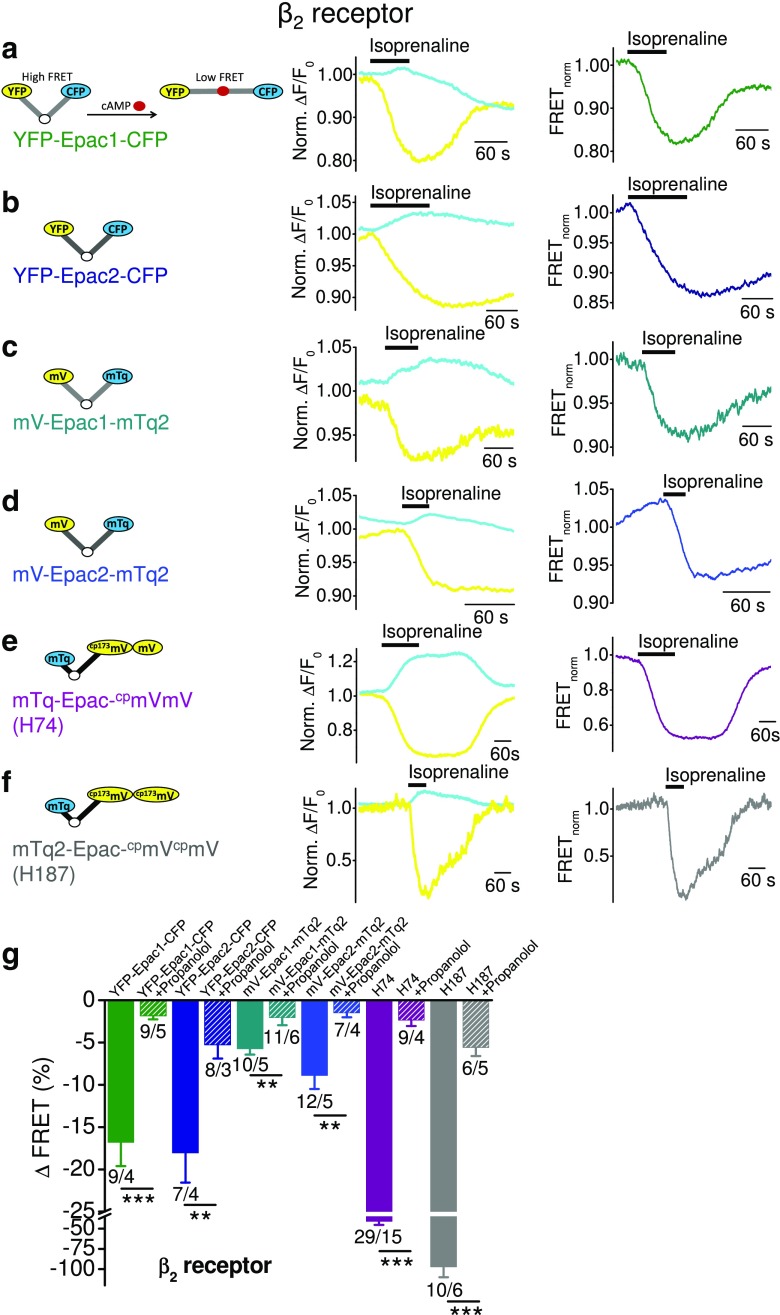
Optimized FRET-based cAMP sensors are effective in monitoring Gs-mediated cAMP level increases. FRET measurements with HEK293 cells endogenously expressing Gs-protein-coupled β2 receptors together with one of the indicated FRET-based cAMP sensors: YFP-Epac1-CFP (a), YFP-Epac2-CFP (b), mV-Epac1-mTq2 (c), mV-Epac2-mTq2 (d), mTq-Epac-cpmVmV (H74) (e), and mTq2-Epac-cpmVcpmV (f). a–f Representative FRET measurements are displayed showing time courses of the normalized yellow and cyan fluorescence signals (left) and of the normalized FRET signals (right). Black bars indicate application of the β receptor agonist isoprenaline (200 μM). Left insets, schematic illustration of the different FRET-based cAMP sensors Epac. The Epac protein is N- and C-terminally fused to two fluorophores. If cAMP is not bound to Epac, both fluorophores are in close proximity of less than 10 nm to each other resulting in a FRET signal. Binding of cAMP to Epac due to Gs-coupled receptor activation causes conformational change of the protein which results in greater distance of both fluorophores which leads to FRET signal decreases. The white circle displays the cAMP binding site in the Epac protein; cAMP is displayed as red dot. g summary of FRET signal decreases induced by isoprenaline in the presence (hatched bars) or absence (solid bars) of the selective β2 receptor antagonist propranolol (1.5 mM). Numbers over bars indicate the numbers of measured cells and the number of individual coverslips from at least 3 experimental days. Significances tested between propranolol-treated and untreated cells. **P < 0.01, ***P < 0.001

