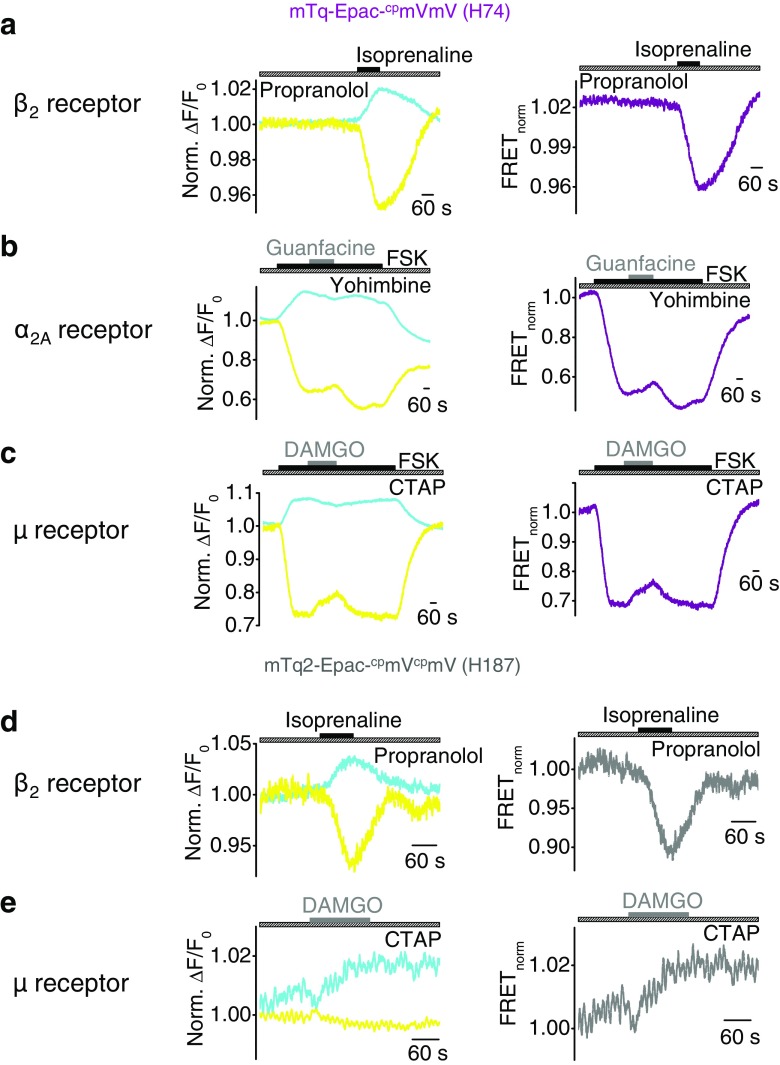
Fig. 4.
Agonist-induced FRET signal changes can be suppressed by selective receptor antagonists. FRET measurements with HEK293 cells endogenously expressing Gs-protein-coupled β2Rs or over-expressing Gi/o-protein-coupled α2A or μ receptors together with the FRET-based Epac sensor H74 (a–c) or H187 (d, e). a–e Representative FRET measurements are displayed with time courses of the normalized yellow and cyan fluorescence signals (left) and of the normalized FRET signals (right). Hatched bars indicate application of the selective antagonists propranolol (1.5 mM, a, d), yohimbine (1.0 mM, b), and CTAP (500 nM, c, e). Gray bars show application of the agonists isoprenaline (200 μM), guanfacine (200 μM), and DAMGO (100 nM). b, c Application of the adenylyl cyclase activator forskolin (1 μM, FSK) in submaximal concentration to increase basal cAMP levels is displayed

