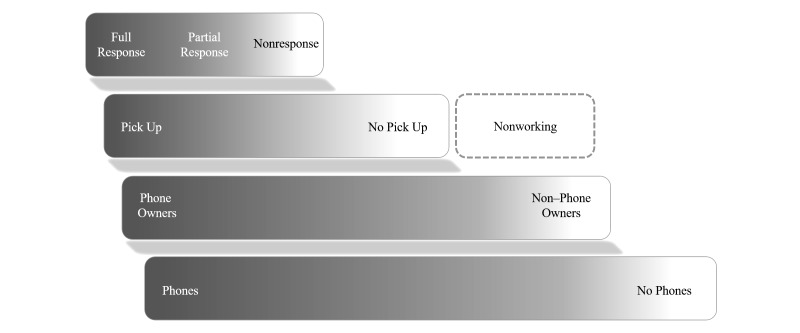
Figure 1.
Statistical challenges for each phase of MPS. The figure illustrates the challenges in capturing specific denominators in MPS, where the bottom layer is the complete population, which comprises phone owners and non–phone owners. A cascading gradient has been used to depict the uncertainty and variability, by setting, in the proportions of either group at each layer. Various types of loss and attrition, from nonresponse to invalid numbers, reduce the total number of units sampled successfully and completely.

