
Figure 2.
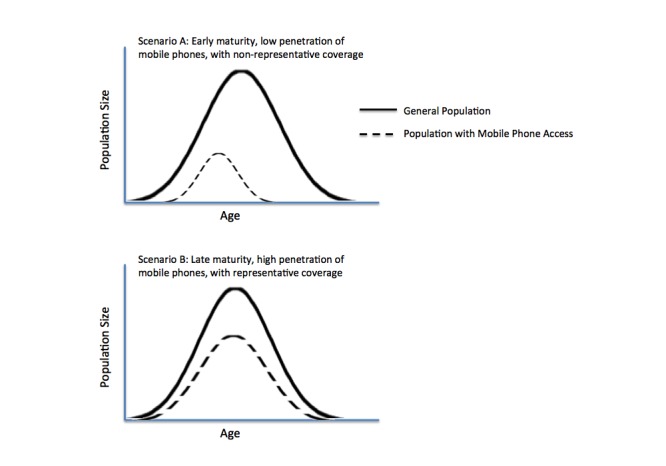
Mobile phone access across two theoretical populations, using age as an illustrative respondent characteristic through which representativeness can be assessed. The figure illustrates a hypothetical population distribution against a distribution of mobile phone ownership, under conditions of low (scenario A) and high (scenario B) mobile penetration. In scenario A, common to populations where mobile phones have recently been introduced, obtaining a representative sample through MPS may not be feasible, even using AASM. As mobile markets mature, the overlap in distributions increases, allowing methods like AASM and random digit dialing to improve the capture of a sample that closely reflects the population-at-large.