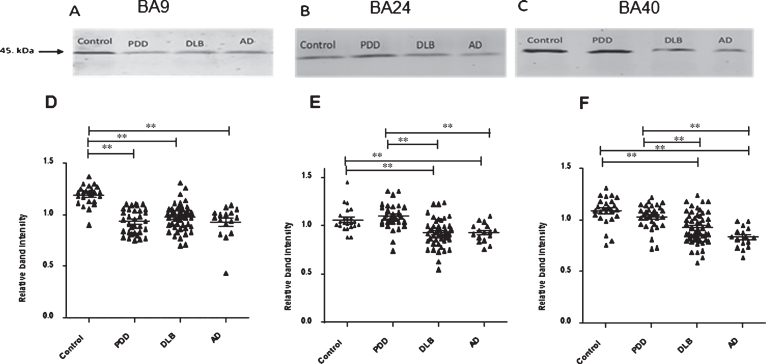
Fig.1.
19S ATPase RPT6, proteasome sub-unit values, from semi-quantitative western blotting in PDD, DLB, AD, and control in BA9, BA24, and BA40. The image is a representative western blot showing an example of the diagnosis-specific reductions of the 19S ATPase RPT6 in BA9 (A), BA24 (B), and BA40 (C). Statistical analysis was performed using one-way analysis of variance (ANOVA) and Bonferronipost hoc test. BA9 (D): Mean RPT6 values from controls (n = 24) were significantly higher than Parkinson’s disease dementia (PDD) (p = 0.001, n = 33), dementia with Lewy bodies (DLB) (p = 0.001, n = 50), and AD (p = 0.001, n = 16) groups, one-way ANOVA (F = 24.303, d.f. = 3, 119, p = 0.001 followed by Bonferroni post hoc test). BA24 (E): Mean RPT6 values for the control (n = 24) and PDD (n = 33) groups were significantly higher than DLB (p < 0.05, n = 52) and AD (p < 0.05, n = 16) groups. There was no difference between the control and PDD groups, one-way ANOVA (F = 13.56, d.f. = 3 and 113, p = 0.001; Bonferroni post hoc test). BA40 (F): There was no significant difference in RPT6 levels between controls and PDD, but RPT6 levels for the control group (n = 24) and PDD (n = 33) groups were significantly higher than DLB (p < 0.05, n = 52) and AD (p = 0.001, n = 16) groups, one-way ANOVA (F = 16.333, d.f. = 3 and 121, p = 0.001; Bonferroni post hoc test). The horizontal bars within the data points in the graphs represent the mean values. (**p < 0.01).

