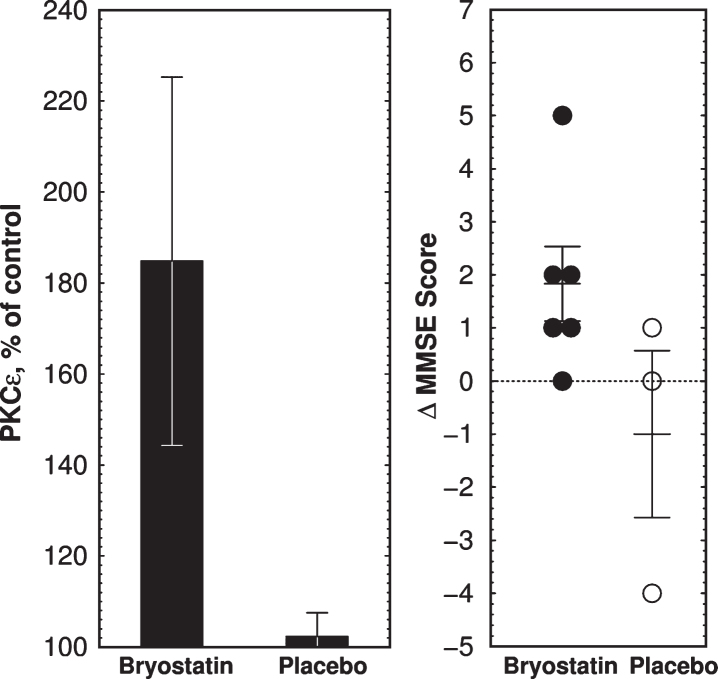
Fig.2.
Clinical trial outcome of bryostatin 1 treatment in Phase IIa AD trial. A) Mean PKCɛ changes above preinfusion level at 1 h measured in PBMCs collected from 6 bryostatin 1 and 3 placebo-treated patients. Note expanded y-axis. PKCɛ values are percent of blank-subtracted control in chemiluminescence units (mean±SEM). B) Changes in MMSE scores. MMSE is scored in discrete integers on a scale from 0 (severe dementia) to 30 (normal). MMSE scores in bryostatin-treated subjects were increased at 3 h (p = 0.041, paired t-test) but not at 4d or 15d (not shown).

