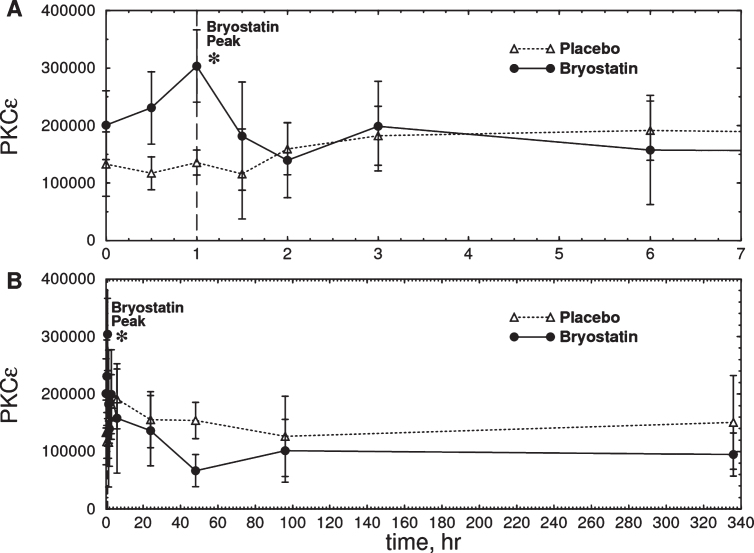
Fig.3.
Time course of total PKCɛ measured in PBMC samples from six Phase IIa subjects treated with bryostatin 1. A) Expanded scale (0–7 h). B) Full scale (0–340 h). There was an increase in total PKCɛ in the bryostatin group but not in the placebo at 1 h after the start of infusion (Bryostatin F(7.013, 21.039) = 3.026, p = 0.023; placebo F(10,20) = 0.75, p = 0.67, repeated measures ANOVA; p = 0.0185 at 1 h, two-tailed matched pair t-test) Bryostatin also decreased PKCɛ between 12 h and 72 h (p = 0.0296, two-tailed matched pair t-test, average of 12, 48, and 72 h points). Data points are mean PKCɛ in arbitrary units±SEM (Placebo, n = 3; Bryostatin 1, n = 6). The treated and placebo groups are not significantly different at t = 0.

