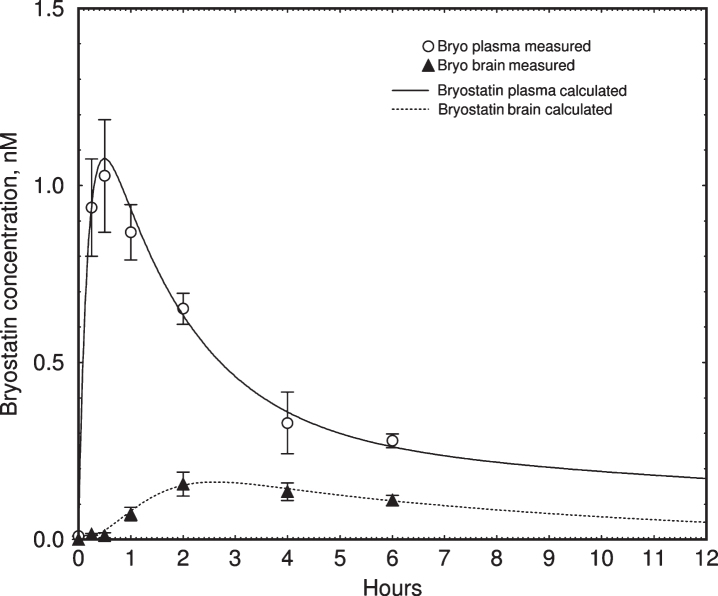
Fig.6.
Pharmacokinetic simulation of bryostatin 1 blood plasma concentration in mouse. Upper curve = blood plasma. Lower curve = brain. Values are mean±SEM, n = 3–6 mice per group. The lower curve was fitted to measured values using a simple saturable brain uptake model using parameters of Vmuptake = 0.017 nM min–1, Kmuptake = 1.5 nM, and rate constant of elimination = 0.027 min–1.

