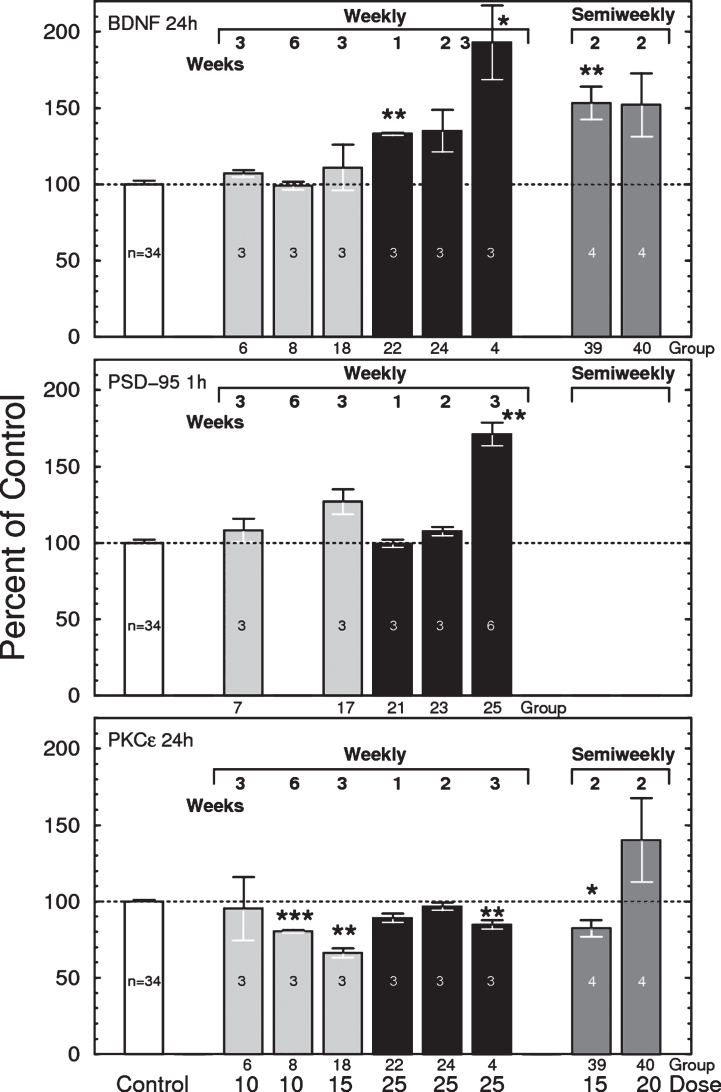
Fig.7.
Top: Total brain BDNF measured 24 h after i.v. injections of bryostatin 1 in mice. Only weekly treated groups are shown. Each bar represents 3 to 6 mice except control = 31 mice (F(40,74) = 12.48, p < 0.0001, ANOVA, includes all thirteen 24-h treated groups). Bars are mean±SEM. *p < 0.05, **p < 0.01. See Table 1 for dosing schedule. Middle: Effects of bryostatin 1 on mouse brain PSD-95 measured 1 h after i.v injection of bryostatin. Each bar represents 3 to 6 mice except control = 31 mice (F(20,53) = 4.028, p < 0.0001). Bars are mean±SEM. **p < 0.01. Bottom: Total brain PKCɛ measured by PKCɛ-specific ELISA 24 h after i.v. injection of bryostatin 1 in mice. Only weekly treated groups are shown. Each bar represents 3 to 6 mice except control = 31 mice (F(40,74) = 12.48, p < 0.0001, ANOVA). Bars are mean±SEM). **p < 0.01, ***p < 0.001.

