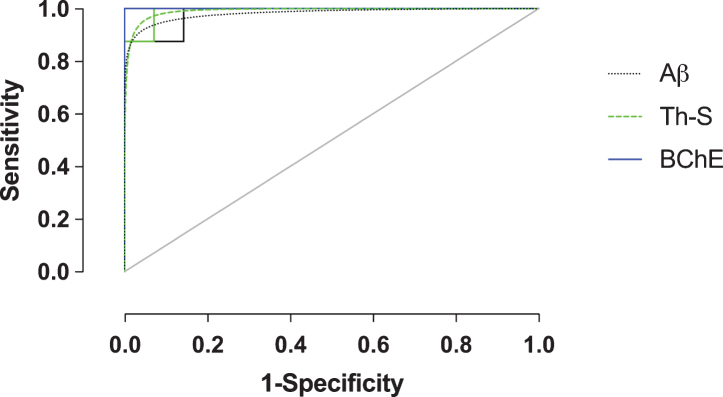
Fig.4.
Receiver-operating characteristic (ROC) plot (sensitivity versus 1-specificity) of amyloid-β (Aβ), thioflavin-S (Th-S), and butyrylcholinesterase (BChE) quantification metrics of the orbitofrontal cortex. Empirical data shown as solid lines and fitted curves as dashed lines of the same color. Chance association shown as diagonal line indicates no discriminative capability of a diagnostic test. The area under the curve (AUC) serves as a summary measure of the diagnostic performance of each metric. BChE showed high diagnostic accuracy. See Table 2 for a complete list of ROC summary measures.

