
Fig. 1.
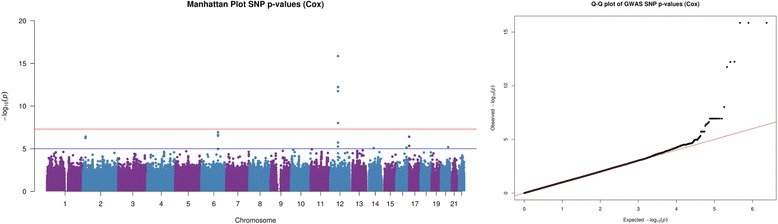
Graphical representation from proportional hazards data SNP analysis. Graphical output from simulation study. (Left) Manhattan plot of Cox proportional hazards analysis SNP p-values & (Right) Cox proportional hazards analysis QQ-plot
Official websites use .gov
A
.gov website belongs to an official
government organization in the United States.
Secure .gov websites use HTTPS
A lock (
) or https:// means you've safely
connected to the .gov website. Share sensitive
information only on official, secure websites.
Graphical representation from proportional hazards data SNP analysis. Graphical output from simulation study. (Left) Manhattan plot of Cox proportional hazards analysis SNP p-values & (Right) Cox proportional hazards analysis QQ-plot