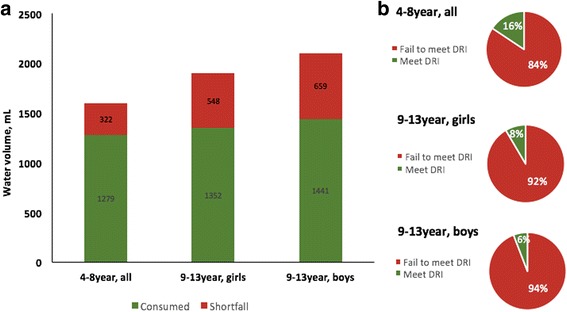
Fig. 4.

Total water intake and deviation from the EFSA recommendation and percentage of children who met the EFSA recommendations by age and gender. a Total water intake and shortfalls (in ml) relative to EFSA recommendation by age and gender. b Percentage of children falling to meet EFSA recommendations by age and gender
