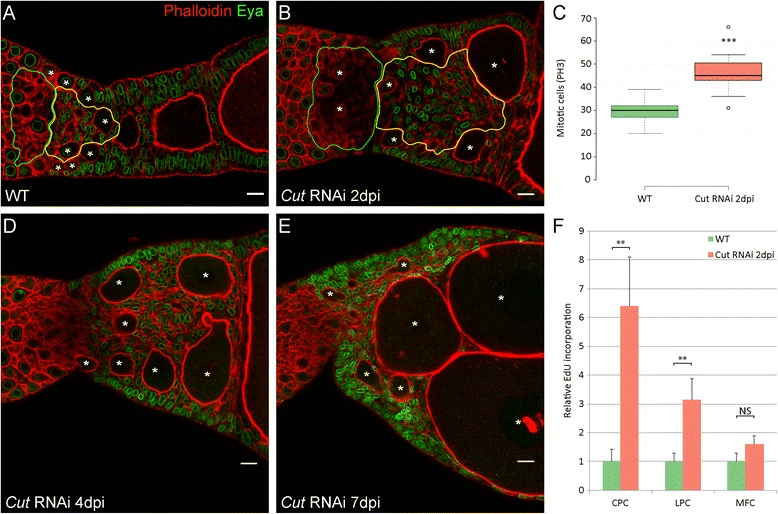
Fig. 6.

a Wild type ovariole stained with Phalloidin to visualize f-Actin (red) and an antibody against Eya (green). b, d, e RNAi phenotypes of Cut at indicated time points. The Knockdown of Cut results in the over proliferation of follicle cell populations with CPCs showing the strongest effect (b, yellow outline). Oocytes are not longer aligned, but positioned of side-by-side (asterisks). At subsequent dissections continuous growth of oocytes can be observed, resulting in the dislocation of CPCs (d–e). c Box plot of PH3 positive cells in WT (green) and Cut RNAi at 2dpi (red) shows increased mitosis rate after Cut knockdown. Centre lines show the medians; box limits indicate the 25th and 75th percentiles as determined by R software; whiskers extend 1.5 times the interquartile range from the 25th and 75th percentiles, outliers are represented by dots. n = 13, 11 sample points. f EdU signals in WT and Cut RNAi normalized to the mean of wild type. Error bars represent standard deviation. Central pre-follicular cells show the highest relative EdU incorporation (f). ** and *** P < 0.01 and P < 0.001 using a two-tailed t-test, respectively. Scale bar: 10 μm
