Fig. 3.

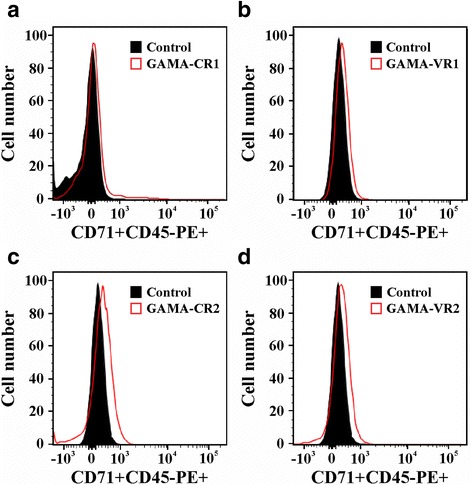
Flow cytometry analysis. Histograms of conserved (a and c) and variable (b and d) GAMA fragments compared to control (cells not incubated with the protein). Each figure is representative from three independent experiments

Flow cytometry analysis. Histograms of conserved (a and c) and variable (b and d) GAMA fragments compared to control (cells not incubated with the protein). Each figure is representative from three independent experiments