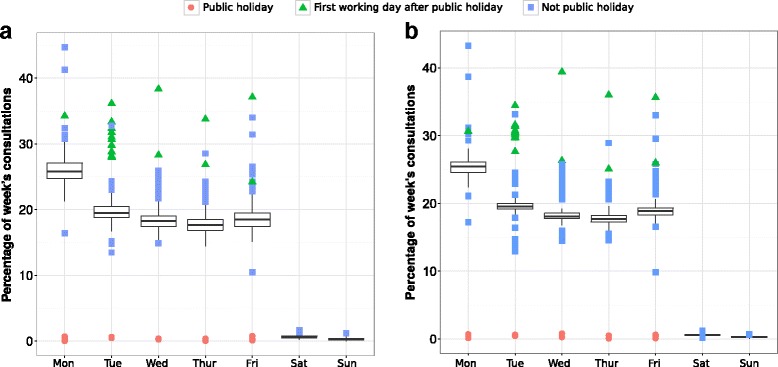
Fig. 1.

Box plots of data from the GP in-hours syndromic surveillance system demonstrating the day of the week and public holiday effects for the (a) severe asthma indicator and (b) gastroenteritis indicator. Daily consultation numbers for each day between 2nd April 2012 and 11th January 2015 were grouped into weeks from Monday to Sunday and the proportion of the week's consultations on each day of the week are summarised in the box plots
