Fig. 1.

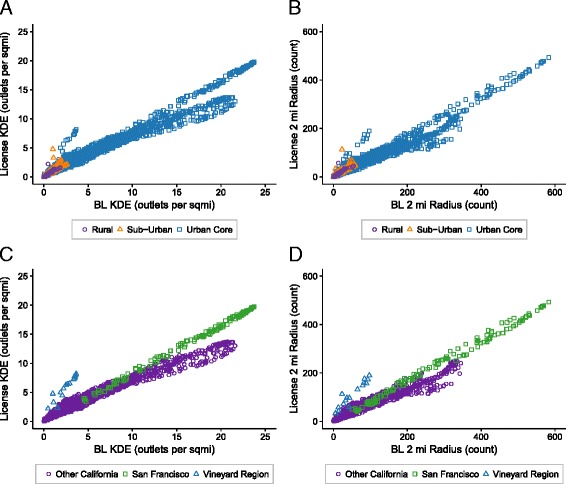
Scatterplots of license and BL density measures illustrating KDE (a and c) and 2 mi radius (b and d), by RUCA category (a and b) and by regions (c and d)

Scatterplots of license and BL density measures illustrating KDE (a and c) and 2 mi radius (b and d), by RUCA category (a and b) and by regions (c and d)