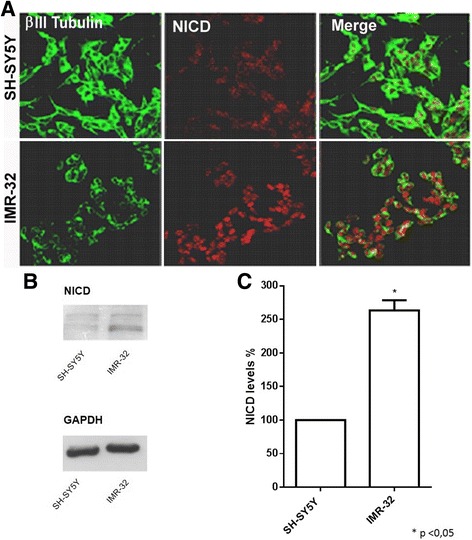
Fig. 2.

Analysis of Notch pathway activation in neuroblastoma cells with different MYCN gene amplification. SH-SY5Y and IMR-32 cells were chosen as the two cell lines with the lowest and the highest N-Myc mRNA expression. a Confocal analysis of NICD expression levels in SH-SY5Y and IMR-32 cells. β III tubulin antibody (green) was used as neuron marker; NICD antibody (red) showed a typical nuclear localization, indicative of Notch activation. b Western blot analysis of NICD protein expression in SH-SY5Y and IMR-32 cells. c Densitometric analysis of NICD expression levels in SH-SY5Y and IMR-32 cells using Quantity One analysis software. *p < 0.05 vs SH-SY5Y cell line
