
Fig. 4.
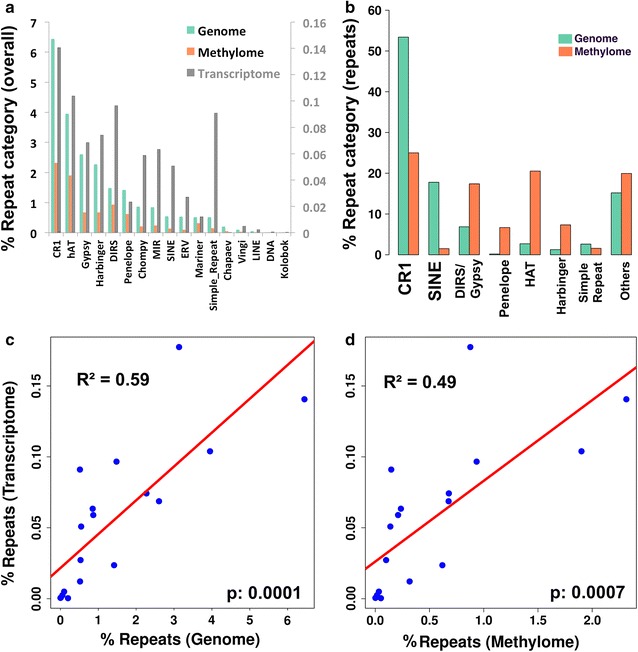
Chrysemys picta repeat abundance. a Relative abundance of repeat categories in the Chrysemys picta genome [37], and their relative abundance in the hatchling gonadal methylome (this study) and embryonic gonadal transcriptome [42] as a fraction of the genome. Note that repeat abundance in the transcriptome is plotted in gray and scaled by the right-hand axis for visualization purposes. b Relative abundance of various repeat categories within the fraction of repeats present in the C. picta genome [37] versus the methylome (this study). c Regression of transcriptomic repeat abundance as a function of repeat abundance in the genome (p = 0.0001) and d in the methylome (p = 0.0007). Abundance of repeats in the transcriptome is slightly better explained by their genomic abundance (R 2 = 0.59) than by their abundance in the methylome (R 2 = 0.49)