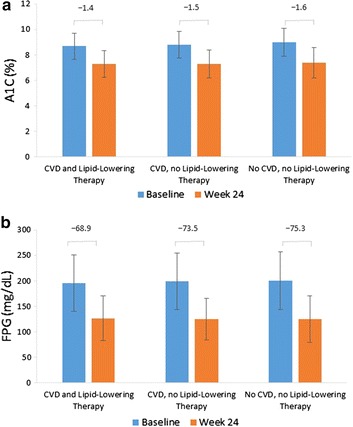
Fig. 1.

HbA1c (a) and FPG (b) at baseline and Week 24 ±CVD or lipid-lowering therapy. Data presented represent mean (standard deviation). P < 0.05 between patients treated with lipid-lowering therapy versus not treated for HbA1c at baseline and change to Week 24, differences were not significant in FPG
