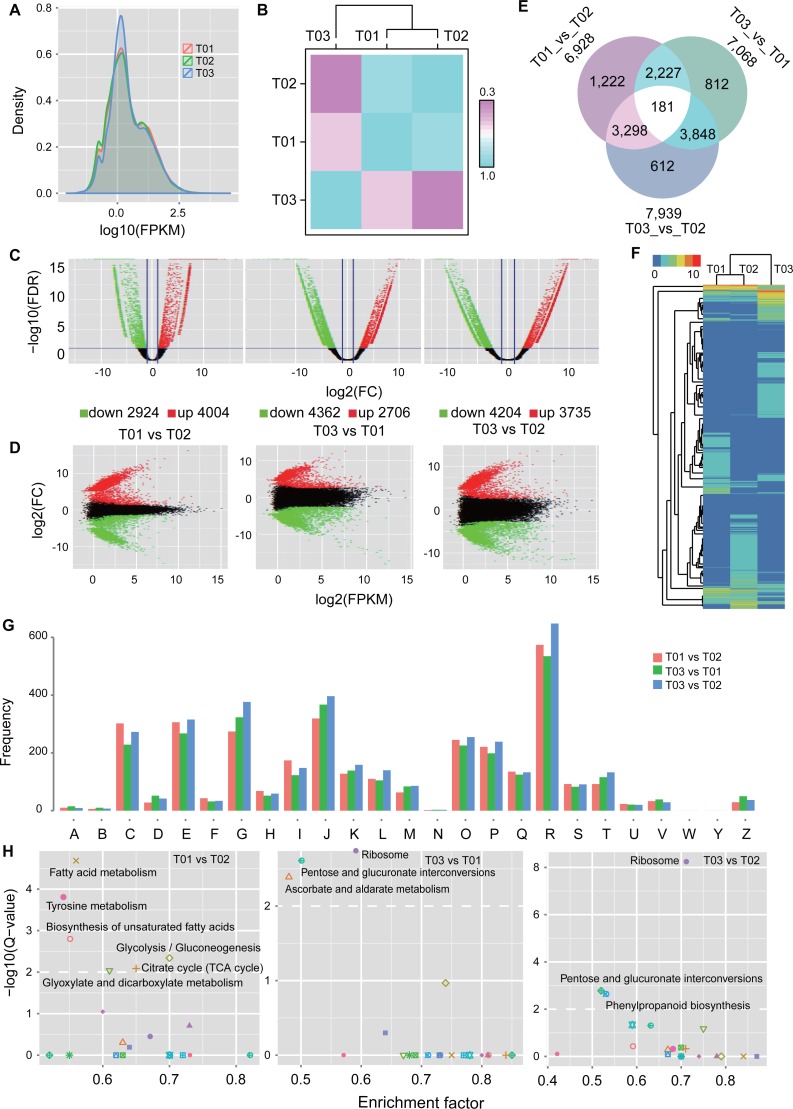
Figure 3. Differential expressed unigenes in the Chinese goldthread from Zhenping (T01), Zunyi (T02) and Shizhu (T03).
(A) Distribution of FPKM values from each sample. (B) Pearson correlation of the samples. Each grid denotes the corresponding Pearson correlation coefficient between the two samples. (C, D) Global view of transcriptional changes by volcano and MA plot of unigenes. Genes with >2.0 log2 fold-change values and FDR < 0.01 were identified as significantly differentially expressed genes and colored with red and green. (E) Venn diagrams illustrating differentially expressed unigenes either shared or unique to specific comparison. (F) Hierarchical clustering analysis of unigene expression profiles of DEGs from the three samples. (G) COG annotation of DEGs. (H) KEGG enrichment analyses of DEGs, and significantly over-represented maps were labeled.

