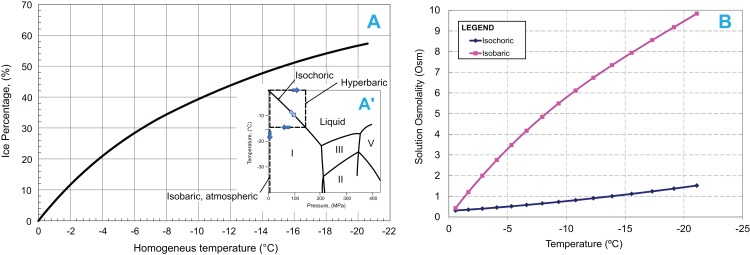
Figure 1. (A) Ice percentage-homogenized temperature diagram during freezing in an isochoric system.
The temperature is homogenized with the temperature at which the tested solution freezes at atmospheric pressure. Insert in A′: Pressure–Temperature diagram for water and process lines for isobaric atmospheric, hyperbaric and isochoric freezing processes. (B) Comparison of osmolality as a function of temperature during isochoric and isobaric (at 1 atm) freezing of the same solution.

