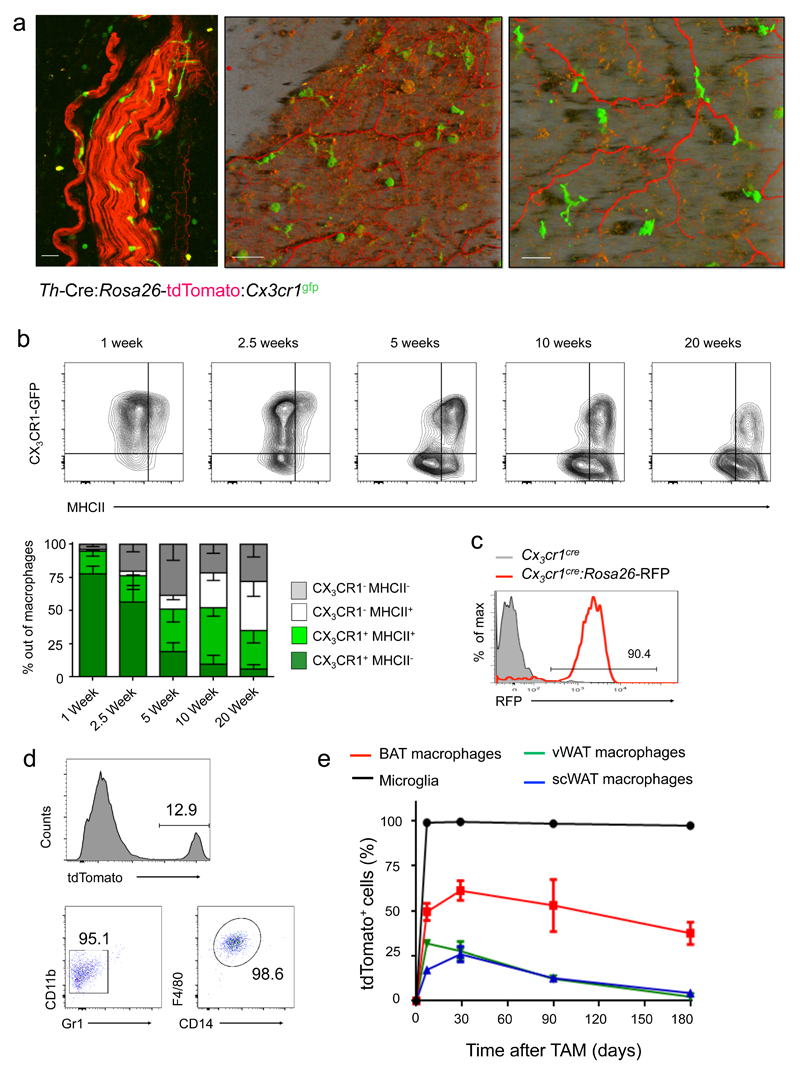
Fig. 6. Characterization of brown adipose tissue macrophages.
(a) Two-photon microscopy of iBAT obtained from Th-Cre:Rosa26-tdTomato:Cx3cr1gfp mice. Original image size was: 424.27 µm, y: 424.27 µm, z: 23.69 µm; Z-Stack of 24 images was acquired; Shadow Projection mode (left and middle figures) and Maximum Intensity Projection (MIP) mode (right Fig.) of Zen Imaging Software were used in order to render a represented images of both tdTomato and GFP channels. Data are representative of 6 mice. Scale bars from left to right: 50 μm, 50 μm and 25 μm.
(b) FACS analysis of BAT macrophages obtained from Cx3cr1gfp mice at different ages for Cx3cr1/GFP and MHC II expression. n=4 for each age. Bar diagram summarizing data.
(c) FACS analysis of iBAT macrophages of Cx3cr1Cre:Rosa26-RFP mouse; cells are gated as in (b). Data are representative of three mice.
(d) FACS analysis of iBAT macrophages of TAM-treated Cx3cr1creER:Rosa26-tdTomato mouse, 6 months post TAM treatment. Data are representative of three mice.
(e) Fate mapping of indicated macrophage populations in TAM-treated Cx3cr1creER:Rosa26-tdTomato mice. n=3.

