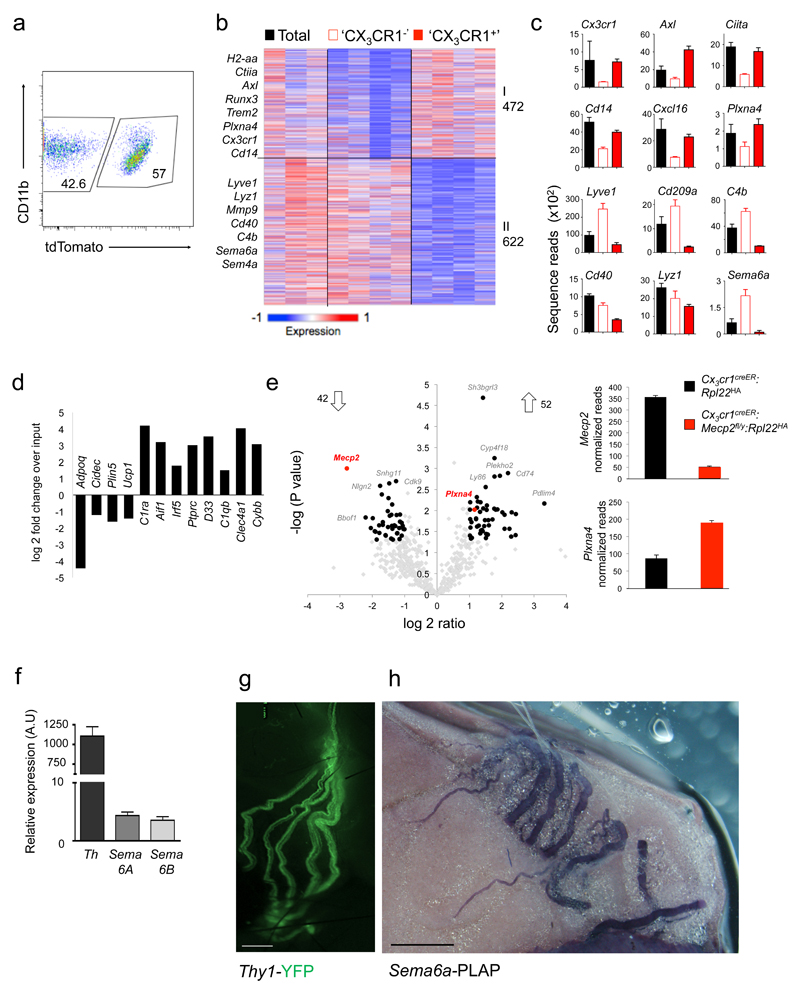
Fig. 7. Mecp2-mutant macrophages overexpress PlexinA4 and might interact with Sema6A-expressing sympathetic axons in BAT.
(a) FACS plot indicating sorting gates for tdTomato+ and tdTomato– population, isolated from TAM-treated Cx3cr1creER:Rosa26-tdTomato mice. Data are representative of four mice.
(b) K-means clustering (K = 8) of 1094 genes differentially expressed by 'CX3CR1–' and 'CX3CR1+' BAT macrophages.
(c) Bar diagrams illustrating RNA expression of selected genes across macrophage populations presented in (B). ntotal=3, n’cx3cr1-‘=4, n’cx3cr1+’=4.
(d) Bar graph showing enrichment of macrophage genes and de-enrichment of adipocyte genes as determined by RNA-seq of ribosome-attached-mRNAs retrieved by IP of BAT from Cx3cr1CreER:Rpl22HA mice, representing fold change over input (mRNA of total tissue) (n=2)
(e) Volcano plot of statistical significance (-log10(p value)) against log 2 ratio between translatomes of 'CX3CR1' macrophages of Cx3cr1creER:Rpl22HA (n=2) and Cx3cr1creER:Mecp2fl/y:Rpl22HA mice (n=4), based on the RNA-seq data. Significantly changed genes (at least 2 fold change (1 log2 ratio), P value <0.05)) are indicated by red box (left). Bar diagrams illustrating raw normalized reads of Mecp2 and Plexna4 mRNA expression in Cx3cr1creER:Rpl22HA animals (black bars) and Cx3cr1creER:Mecp2fl/y:Rpl22HA animals (red bars) as determined by RNA-seq (right).
(f) RT-PCR analysis of stellate ganglia for Tyrosine hydroxylase and Semaphorin expression. n=3.
(g) Micrograph of main sympathetic neuronal fibers innervating the BAT, as visualized in Thy1-YFP mouse. Scale bar, 450 μm.
(h) Micrograph of BAT of Sema6a-PLAP (human placental alkaline phosphatase) mouse, illustrating Sema6a expression by sympathetic nerves according to PLAP reporter expression. Scale bar, 100 μm.

