
Figure 2. Deposition of beta amyloid in the hippocampus of mice in the WT, APP/PS1 and APP/PS1+FLX groups.
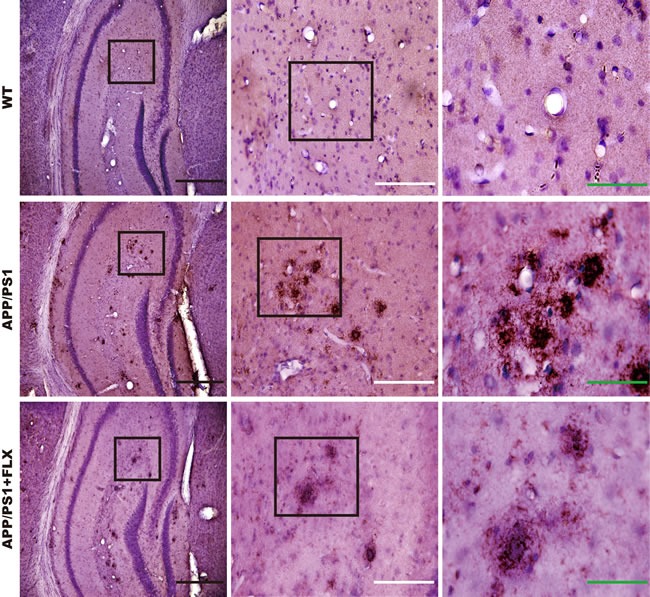
Immunohistochemical staining for beta amyloid in the hippocampus of mice from the three groups. Enlargements show a higher magnification of the indicated areas of interest. Black scale bars = 500 μm; white scale bars = 200 μm; green scale bars = 80 μm.