
Figure 1. Integrin expression and sensitization to TMZ after specific integrin silencing.
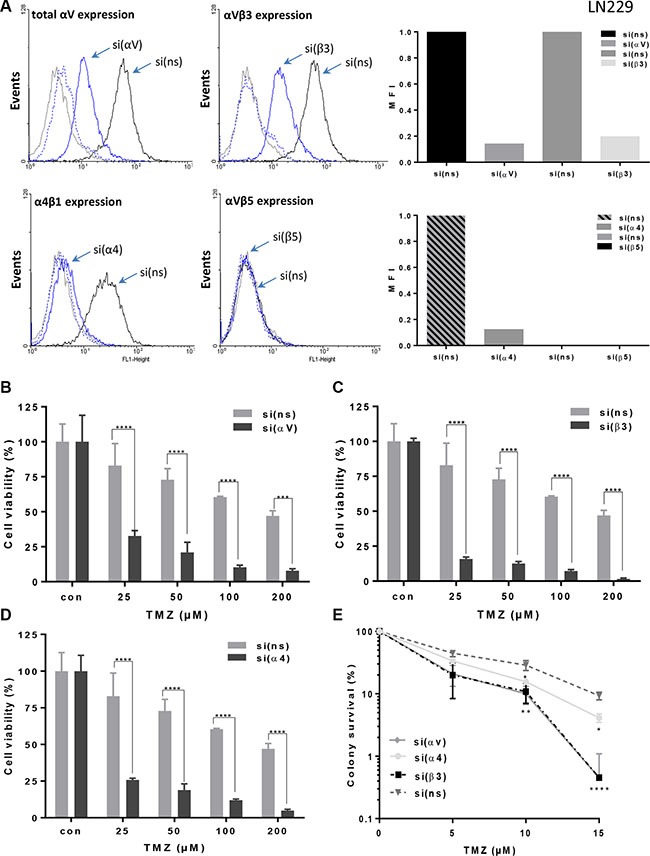
(A) LN229 cells were transfected with integrin αV-, α4-, β3-, β5-or control non-silencing (ns)-siRNA, 48 h later the cells were detached by EDTA and the expression of αVβ3, αVβ5, αV, and α4β1 was measured by flow cytometry. As a negative control, mouse IgG antibodies were used. The expression i.e. effective integrin silencing was quantified by mean fluorescence intensity (MFI) and represented as relative to expression in cells transfected with control non-silencing (ns)-siRNA that was set to 1. The data presented are representative of three independent experiments with similar results. (B–D) LN229 cells were transfected with integrin αV-, α4-, β3-, or ns-siRNA, and 24 h later collected by trypsinization and seeded for cell viability assay (MTT). After another 24 h the cells were treated with TMZ and after six days metabolic activity was assessed. The data are the mean of three independent experiments in quadruplicates ± SD. (E) LN229 cells were seeded in 6-well cluster and 24 h later transfected with integrin αV-, α4-, β3- or ns-siRNA. After additional 24 h cells were re-seeded for colony formation assay at the density of 1000 cells per 6-well dish, and 24 h later exposed to TMZ or left unexposed. Fourteen days later the visible colonies were fixed, stained and counted. The plating efficiency of the cell lines after integrin silencing was ~60–70%. Unexposed integrin-specific and ns-control were set to 100%. The data are the mean of three independent experiments ± SD. *p ≤ 0.05 significant, **p ≤ 0.01 very significant, ***p ≤ 0.005 highly significant, ****p ≤ 0.001 most significant.