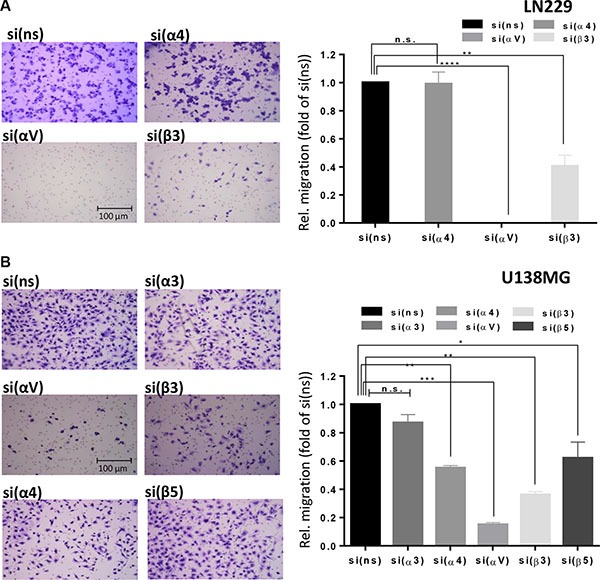
Figure 10. Integrin subunit knockdown decreases migration.

Cell migration was determined in (A) LN229 cells upon transfection with control-, α4-, αv- or β3-siRNA and (B) U138MG cells upon transfection with control-, α3-, α4-, αv-, β5- or β3-siRNA. 48 h after transfection, the cells were starved for 24 h and cell migration was measured in Boyden chambers. After 22 h, cells on the underside of the membrane were stained with crystal violet, photographed and counted. Averages of five microscope fields ± SD are shown. *p ≤ 0.05 significant, **p ≤ 0.01 very significant, ***p ≤ 0.005 highly significant, ****p ≤ 0.001 most significant.
