
Figure 4. The effect of B392 on apoptosis.
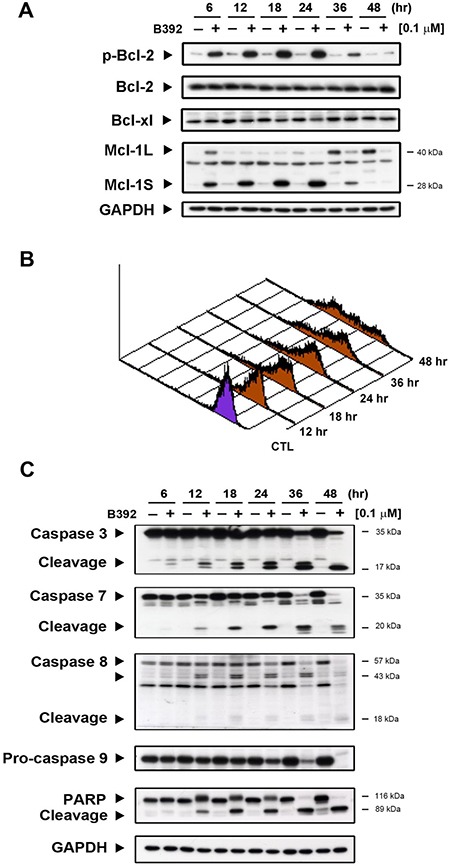
(A) HL60 cells were treated with 0.1 μM B392 for indicated time then were harvested for detection of p-Bcl-2, Bcl-xl, Bcl-2, and Mcl-1 by western blot analysis. (B) The phenomena of mitochondria potential loss was measured by flow cytometry analysis with rhodamine-123. HL60 cells were treated with B392 (0.1 μM) for indicated time and then incubated with rhodamine-123 (10 μM) at 37°C for 30 min. The horizontal axis shows the relative fluorescence intensity, when the right curve shift to the left cure represents a loss of mitochondrial membrane potential. (C) HL60 cells were treated with vehicle (0.1% DMSO) or B392 (0.1 μM) for indicated times. The expressions of cleavage caspases and PARP were detected by western blot analysis. GAPDH used as an internal control.