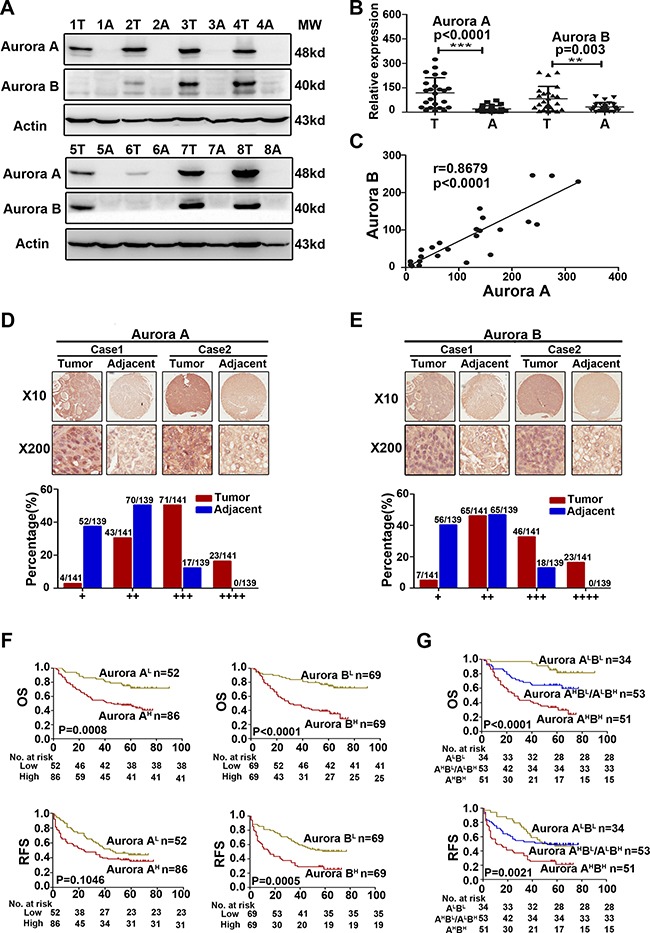
Figure 1. Aurora A and B were overexpressed in parallel and predicted a poorer prognosis in HCC.

(A) WB analysis to determine the expression of Aurora A and B in HCCs and adjacent liver tissues and representative results of 8 out of 24 pairs of tissues were shown. (B) Quantification of Aurora A and B expression in HCCs and adjacent liver tissues (n = 24). (C) A positive linear correlation relationship existed between Aurora A and B at the protein level. (D–E) IHC staining of human HCC tissue array using Aurora A and B-specific antibody, respectively, as described in Material and Methods. And the classification of samples according to the intensity of staining of Aurora A and B expression, respectively. (F) Survival correlation analysis of Aurora A and B expression status in HCC, respectively (n = 138). (G) Survival correlation analysis among the groups of Aurora AHighBHigh (Aurora AHBH), Aurora AHighBLow/ALowBHigh (Aurora AHBL/ALBH) and Aurora ALowBLow (Aurora ALBL), with different Aurora expression status (n = 138). OS, overall surivival rate; RFS, relapsed free survival rate; **p < 0.01, ***p < 0.001.
