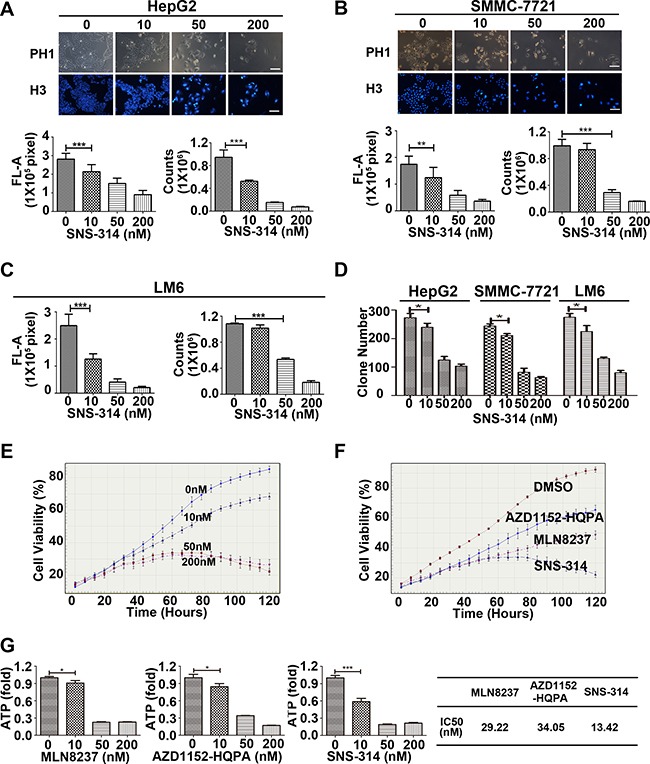
Figure 2. The growth-suppressive effect of inhibitors of Aurora kinases on HCC cells.

(A–C) SNS-314 inhibited the proliferation of HepG2 (A), SMMC-7721 (B) and LM6 (C) cells under the indicated concentrations for 96h, then stained with Hoechst 33342 and analysed according to the Material and Methods, and representative images were shown in HepG2 and SMMC-7721; or trypsinized and counted at each time point (n = 3). (D) SNS-314 affected the colony-formation ability of liver cancer cells. HepG2, SMMC-7721 and LM6 cells were treated under the indicated SNS-314 concentrations for 10 days and then subjected to colony-formation assay (n = 3). (E) HepG2 were treated with SNS-314 and monitored in real time by the live-cell imaging system IncuCyte™. Representative growth curves of cells treated with SNS-314 at the indicated concentration were shown. Each curve was performed at least four times, and each time point was determined in triplicate. (F) HepG2 were treated with SNS-314, MLN8237 and AZD1152-HQPA (50 nM), and monitored in real time by the live-cell imaging system IncuCyte™. Representative growth curves of treated-cells with the indicated time were shown. Each curve was performed at least four times, and each time point was determined in triplicate. (G) The IC50s of Aurora inhibitors, MLN8237, AZD1152-HQPA, and SNS-314, in HepG2 treated for 96 h measured by ATPlite assay. H3, Hoechst33342, FL-A, Fluorescence-Area; Mean ± SD; *p < 0.05, **p < 0.01, ***p < 0.001.
