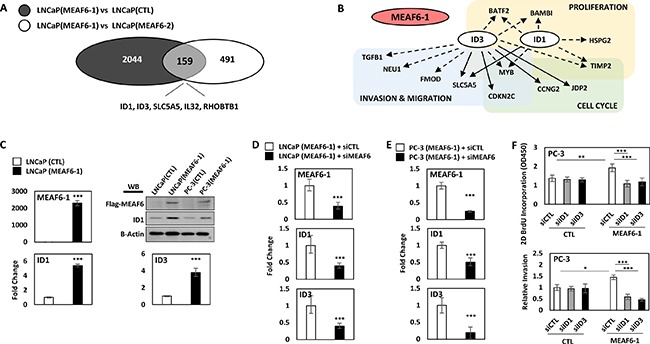
Figure 4. MEAF6-1 function is mediated through ID1 and ID3.

Microarray was performed comparing LNCaP(CTL), LNCaP(MEAF6-1), and LNCaP(MEAF6-2). (A) Gene expressions with fold changes over 1.3 and an adjusted p-value of less than 0.05 from LNCaP(MEAF6-1) vs LNCaP(CTL) were overlapped with LNCaP(MEAF6-1) vs LNCaP(MEAF6-2) transcriptomes. (B) LNCaP(MEAF6-1) vs LNCaP(CTL) transcriptomes were uploaded and analyzed in IPA (Ingenuity Pathway Analysis) for Pathway prediction algorithms of ID1 and ID3. Dashed arrows represent indirect regulation, where solid arrows represent direct regulation. (C) MEAF6-1-regulation of ID1 and ID3 expression was then validated via real-time qPCR. ID1 protein expression was validated by Western blot. (D) LNCaP(CTL) and LNCaP(MEAF6-1) or (E) PC-3(CTL) and PC-3(MEAF6-1) stable lines were transfected with siRNA targeting MEAF6 (siMEAF6) to study the effect of MEAF6-1 on ID1 and ID3 expression. Relative quantification of MEAF6-1, ID1, and ID3 compared to 18S via real-time qPCR. (C-E) All results are presented as the mean ± SEM (Student t-test ***denotes p < 0.001). (F) PC-3(CTL) and PC-3(MEAF6-1) stable cells were transfected with control (siCTL), ID1 (siID1), or ID3 (siID3) targeted siRNA. 2D BrdU cell proliferation assays were performed, where BrdU results represent colorimetric quantitative measurements (optical density, OD, at 450 nm wavelength) of BrdU incorporation into DNA. Cell invasion ability of the PC-3 stable cells with siRNA transfections were measured using matrigel invasion chambers. All results are presented as the mean ± SEM (one-way ANOVA; n = 3; ***denotes p < 0.001 and *denotes p < 0.05).
