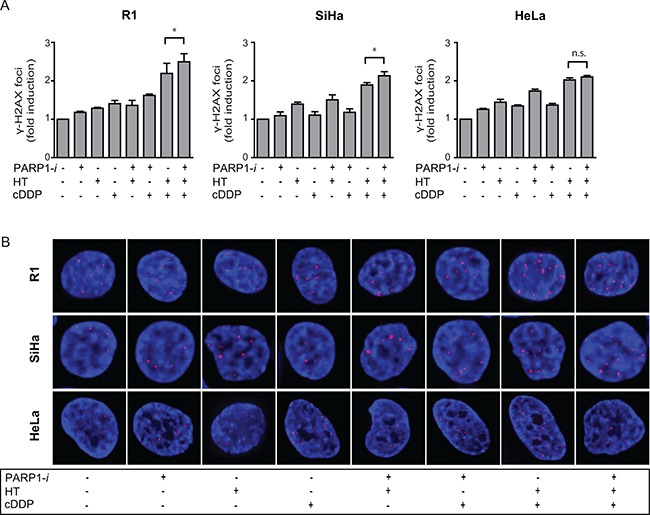
Figure 2. DSBs were analysed using the γ-H2AX assay.

(A) The induction of DSBs in R1 and SiHa was significantly higher after addition of PARP1-i to cDDP-based thermochermotherapy. In HeLa cells this was not found to be significant, although a trend is seen. R1: p = 0.048, SiHa: p = 0.035, HeLa: p = 0.068 From left to right: R1, SiHa, Hela cells. (B) One representative cell is depicted for each condition. Bars represent the mean of three independent experiments with the standard error of the mean (SEM). *p < 0.05.
