
Figure 4. Apoptotic levels measured using the Nicoletti assay.
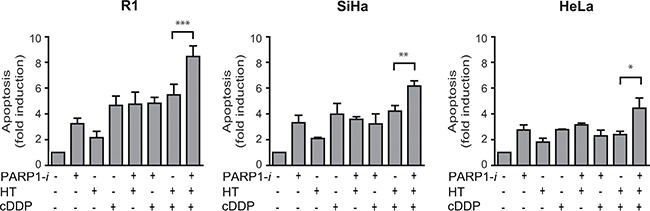
An ~1.5-fold induction in apoptosis is found after treatment with PARP1-i, cDDP and HT compare to cDDP with HT in R1 and SiHa cells (R1: p = 0.0007, SiHa: p = 0.0054). A smaller, though significant effect was found in HeLa cells after addition of a PARP1-i (HeLa: p = 0.026). From left to right: R1, SiHa, Hela cells. *p < 0.05, **p < 0.01, ***p < 0.001.