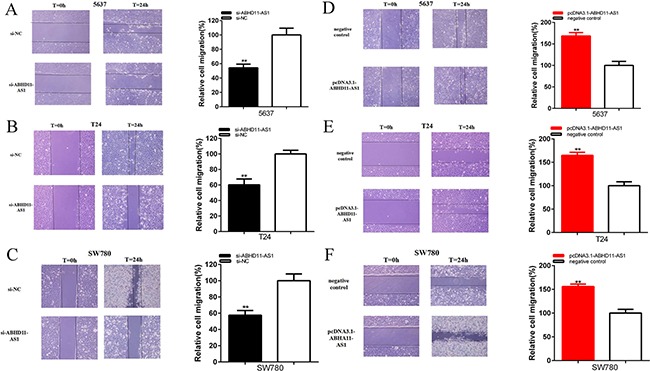
Figure 5. Effects of specific RNA and specific plasmids on cell migration.

Cell migration was suppressed in si-ABHD11-AS1 group compared with si-NC group in 5637 A. T24 B. and SW780 C. Cell migration was suppressed in pcDNA3.1-ABHD11-AS1 group compared with negative control group in 5637 D. T24 E. and SW780 F. Assays were performed in triplicate. All data are shown as mean ± SD (*p < 0.05, **p < 0.01).
