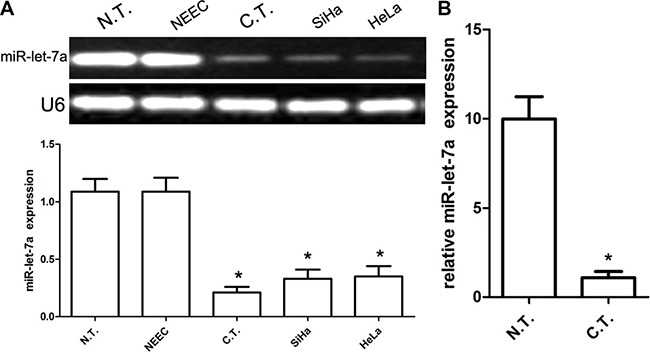
Figure 1. Expression of miR-let-7a in human CC tissues and cell lines.

(A) Relative miR-let-7a messenger RNA-expression levels in representative three samples and cell lines, including SiHa and HeLa were detected by RT-PCR analysis. The average expression was normalized to U6 expression. Each bar represents the mean of three independent experiments. (B) Real-time PCR analysis of miR-let-7a expression in 35 cases of cancer and paired normal tissues. The average expression was normalized to U6 expression. All data are represented as mean ± SEM of at least three replicate experiments unless otherwise noted. *denotes significance at P < 0.001 relative to normal cervical cancer tissues or NEEC by student t-test.
