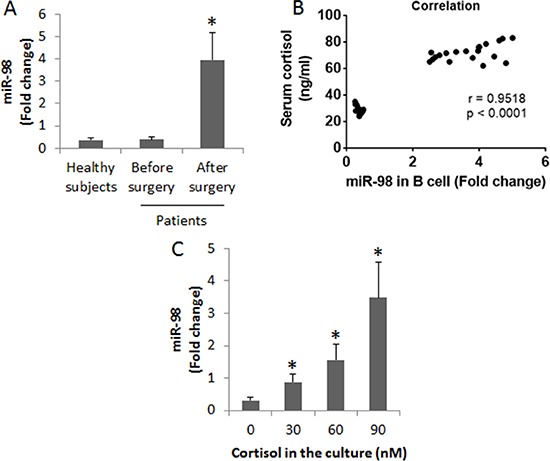
Figure 3. Assessment of miR-98 in B cells.

(A) the peripheral B cells were isolated from the blood samples collected from 20 healthy subjects and 20 patients a week before surgery and 3 days after surgery. The bars indicate the miR-98 levels in peripheral B cells of healthy subjects and patients. (B) the positive correlation between serum cortisol levels and the miR-98 levels in peripheral B cells. (C) miR-98 levels in B cells after exposure to cortisol in the culture for 48 h (the data B were summarized from 3 independent experiments). Data of bars are presented as mean ± SD. *p < 0.01, compared with the healthy subjects (A) or the dose 0 group (C).
