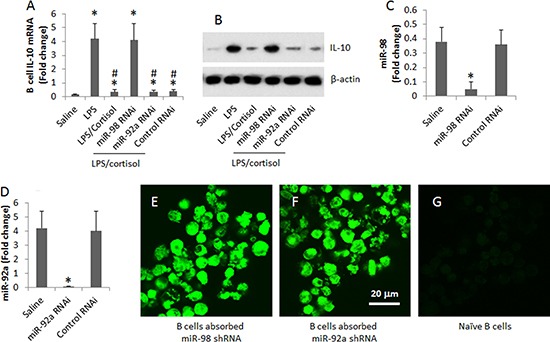
Figure 4. Assessment of the effects of miR-98 on suppression of IL-10 expression in B cells.

(A, B) the levels of IL-10 mRNA (A) and protein (B) in B cells after treatment in the culture as denoted on the X axis. (C) the bars show the results of miR-98 RNAi of B cells. (D) the bars show the results of miR-92a RNAi of B cells. Data of bars are presented as mean ± SD. *p < 0.01, compared with the saline group. (E, F) representative images show that B cells were transduced with miR-98 shRNA (E) or miR-92a shRNA (F) (the shRNA carried a GFP gene; the green color indicates the GFP protein). (G) an image of naive B cells. The data were summarized from 3 independent experiments. Original magnification of E–G: '630.
