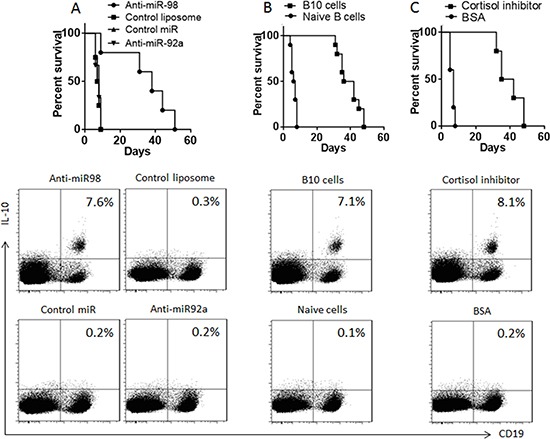
Figure 5. Survival allograft hearts.

(A–C) the survival curves show the survival rates of mice received allograft heart transplantation. The flow cytometry plots show the frequency of B10 cells in the mouse spleen after heart transplantation. The treatments are denoted above each panel. Anti-miR-98 (anti-miR-92a, or control miR): Mice were also anti-miR-98 liposomes (or anti-miR-92a liposomes, or control liposomes). B10 cells (Naïve cells): Mice received B10 cells (or naïve B cells) at 106 cells/mouse one day before surgery. Cortisol inhibitor (B), or B10 cells (C), or cortisol inhibitor or control materials. Each group consists of 10 mice.
