
Figure 2. Principal component analysis of rectal cancer (RC) biopsies belonging to good responders (TRG 1-2) and poor responders (TRG3 and TRG4).
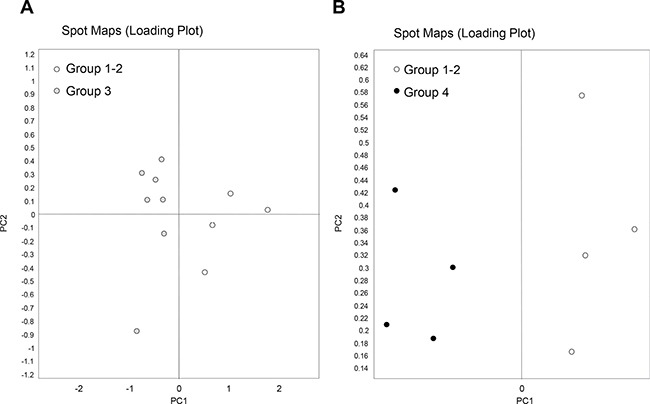
Loading plots show an overview of the all spot maps from all groups. Proteome maps of ‘TRG 1–2′ have been compared with those of either ‘TRG 3′ (A) or ‘TRG 4′ (B). Each circle represents a spot map of a surgical specimen collected from one patient.