
Figure 4. Immunoblotting analyses of three differentially expressed proteins in healthy normal (N) versus rectal tumor (T) tissues belonging to good responders (TRG 1-2) and poor responders (TRG3 and TRG4).
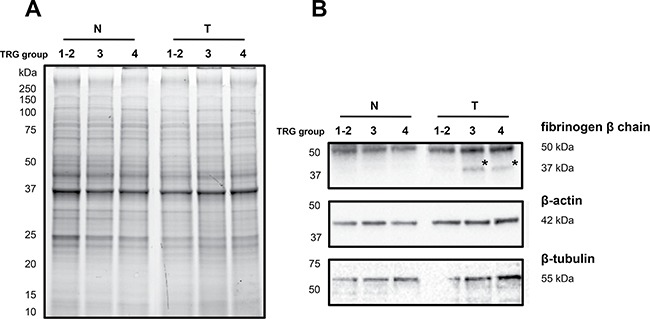
(A) Image of the 1DE gel acquired with Chemidoc before its transfer to nitrocellulose membrane. (B) Signals of proteins cross-reacting with antibodies directed against fibrinogen β-chain, β-actin and β-tubulin. Asterisk indicates the signal of a cross-reacting band at around 37 kDa.