
Figure 6. Protein-protein interaction maps of the overexpressed protein spots in rectal cancers of poor responders (TRG3 and TRG4) before therapy.
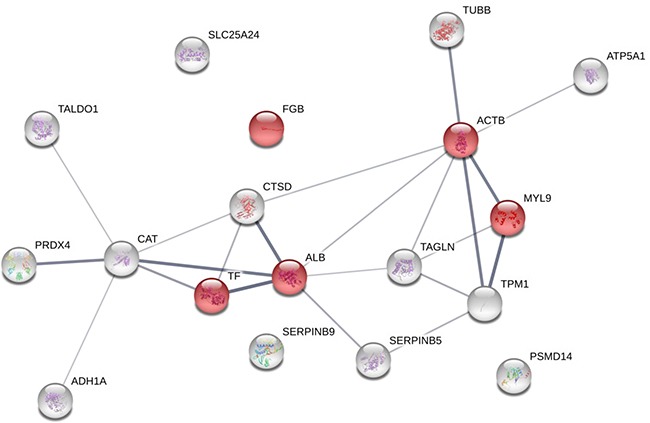
The interaction map of all the identified proteins increasing in content in poor responders is illustrated as confidence view, where the thickness of the connecting lines indicates the level of confidence. Stronger associations are represented by thicker lines. Each circle represents a protein. The proteins involved in ‘platelet activation’ and ‘blood coagulation’ are visualized in red. The STRING tool (http://string-db.org) was used to make the networks and analyse the biological processes.