
Figure 2. The 24 differentially expressed microRNAs between arterial and venous plasma.
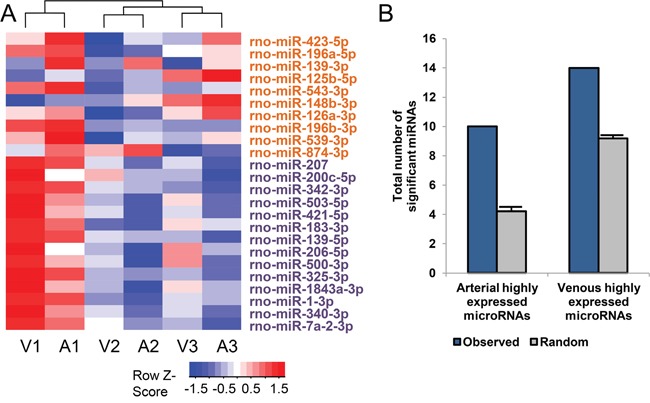
A. Heatmap showing the expression pattern of 24 differentially expressed microRNAs. Samples were hierarchically clustered and the heatmap was scaled by rows (microRNAs). A1, A2, A3 indicate arterial plasma samples from three male rats, while V1, V2, V3 indicate matched venous plasma samples from the same rats. MicroRNAs highly expressed in arterial and venous plasma were labeled orange and violet, respectively. B. Comparison of the observed number of differentially expressed microRNAs and the number resulted from the randomized expression profiles. More specifically, 100 randomly shuffled profiles were tested by paired t-test to find if equivalent number of differentially expressed microRNAs could also be identified from these randomized expression profiles. Error bars indicate standard error.