
Figure 6. Expression correlation between plasma microRNAs and tissue microRNAs.
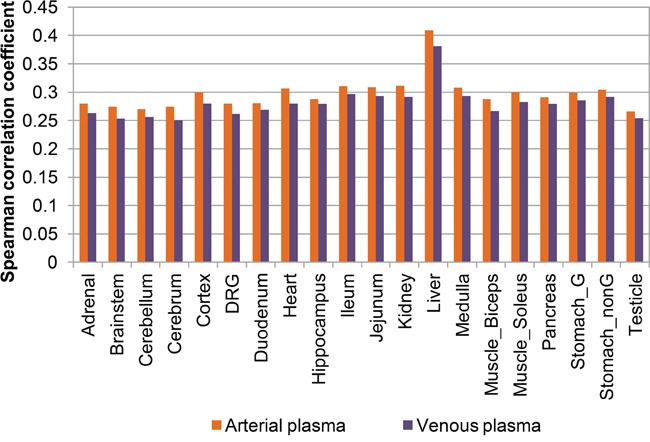
The correlation coefficient of arterial highly expressed microRNAs (orange bars) and venous highly expressed microRNAs (violet bars) with expression profiles of 20 different tissues were shown. Tissue abbreviations shown in this figure were: DRG, dorsal root ganglion; Stomach_G, glandular stomach; Stomach_nonG, non-glandular stomach.