
Figure 4. Sevoflurane preconditioning accelerated microglia activated.
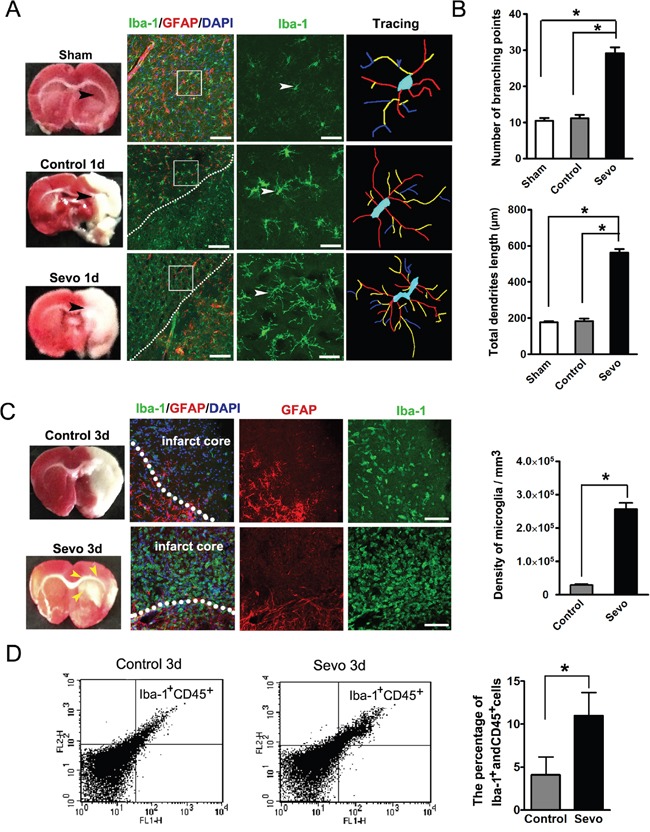
A. Comparison of the morphology of Iba-1 stained microglia in the Sevo group with those in Sham and Control groups on day 1. Boxed area indicates magnified region of the middle panels. Scale bar, 40 μm and 10 μm. B. Comparison of branching and total dendritic length of microglia across Sham, Control and Sevo groups; *P<0.05, n=8. C. Iba-1 stained microglia density in the infarct region both in the Sevo and Control groups on day 3. Dotted lines delineate the boundary of the infarct and the peri-infarct. Yellow arrows indicate the blurry region. Scale bar, 20μm. Histgram showed quantification of microglia density in the infarct on day 3. *P<0.05, n=8. D. Brain cells analyzed by flow cytometry displayed patterns of Iba-1 and CD45 expression between the Sevo-and Control-group, The percentages of Iba-1+ and CD45+ microglia over total cells were quantified and were significantly different; *P<0.05, n=8.